Running a multi-day convention means juggling dozens of events and hundreds of players. Understanding who's attending, what they're playing, and how much revenue you're generating shouldn't require hours of spreadsheet work.
Today we're launching the Convention Analytics Dashboard, a comprehensive tool for convention organizers to understand their player community and event performance at a glance.
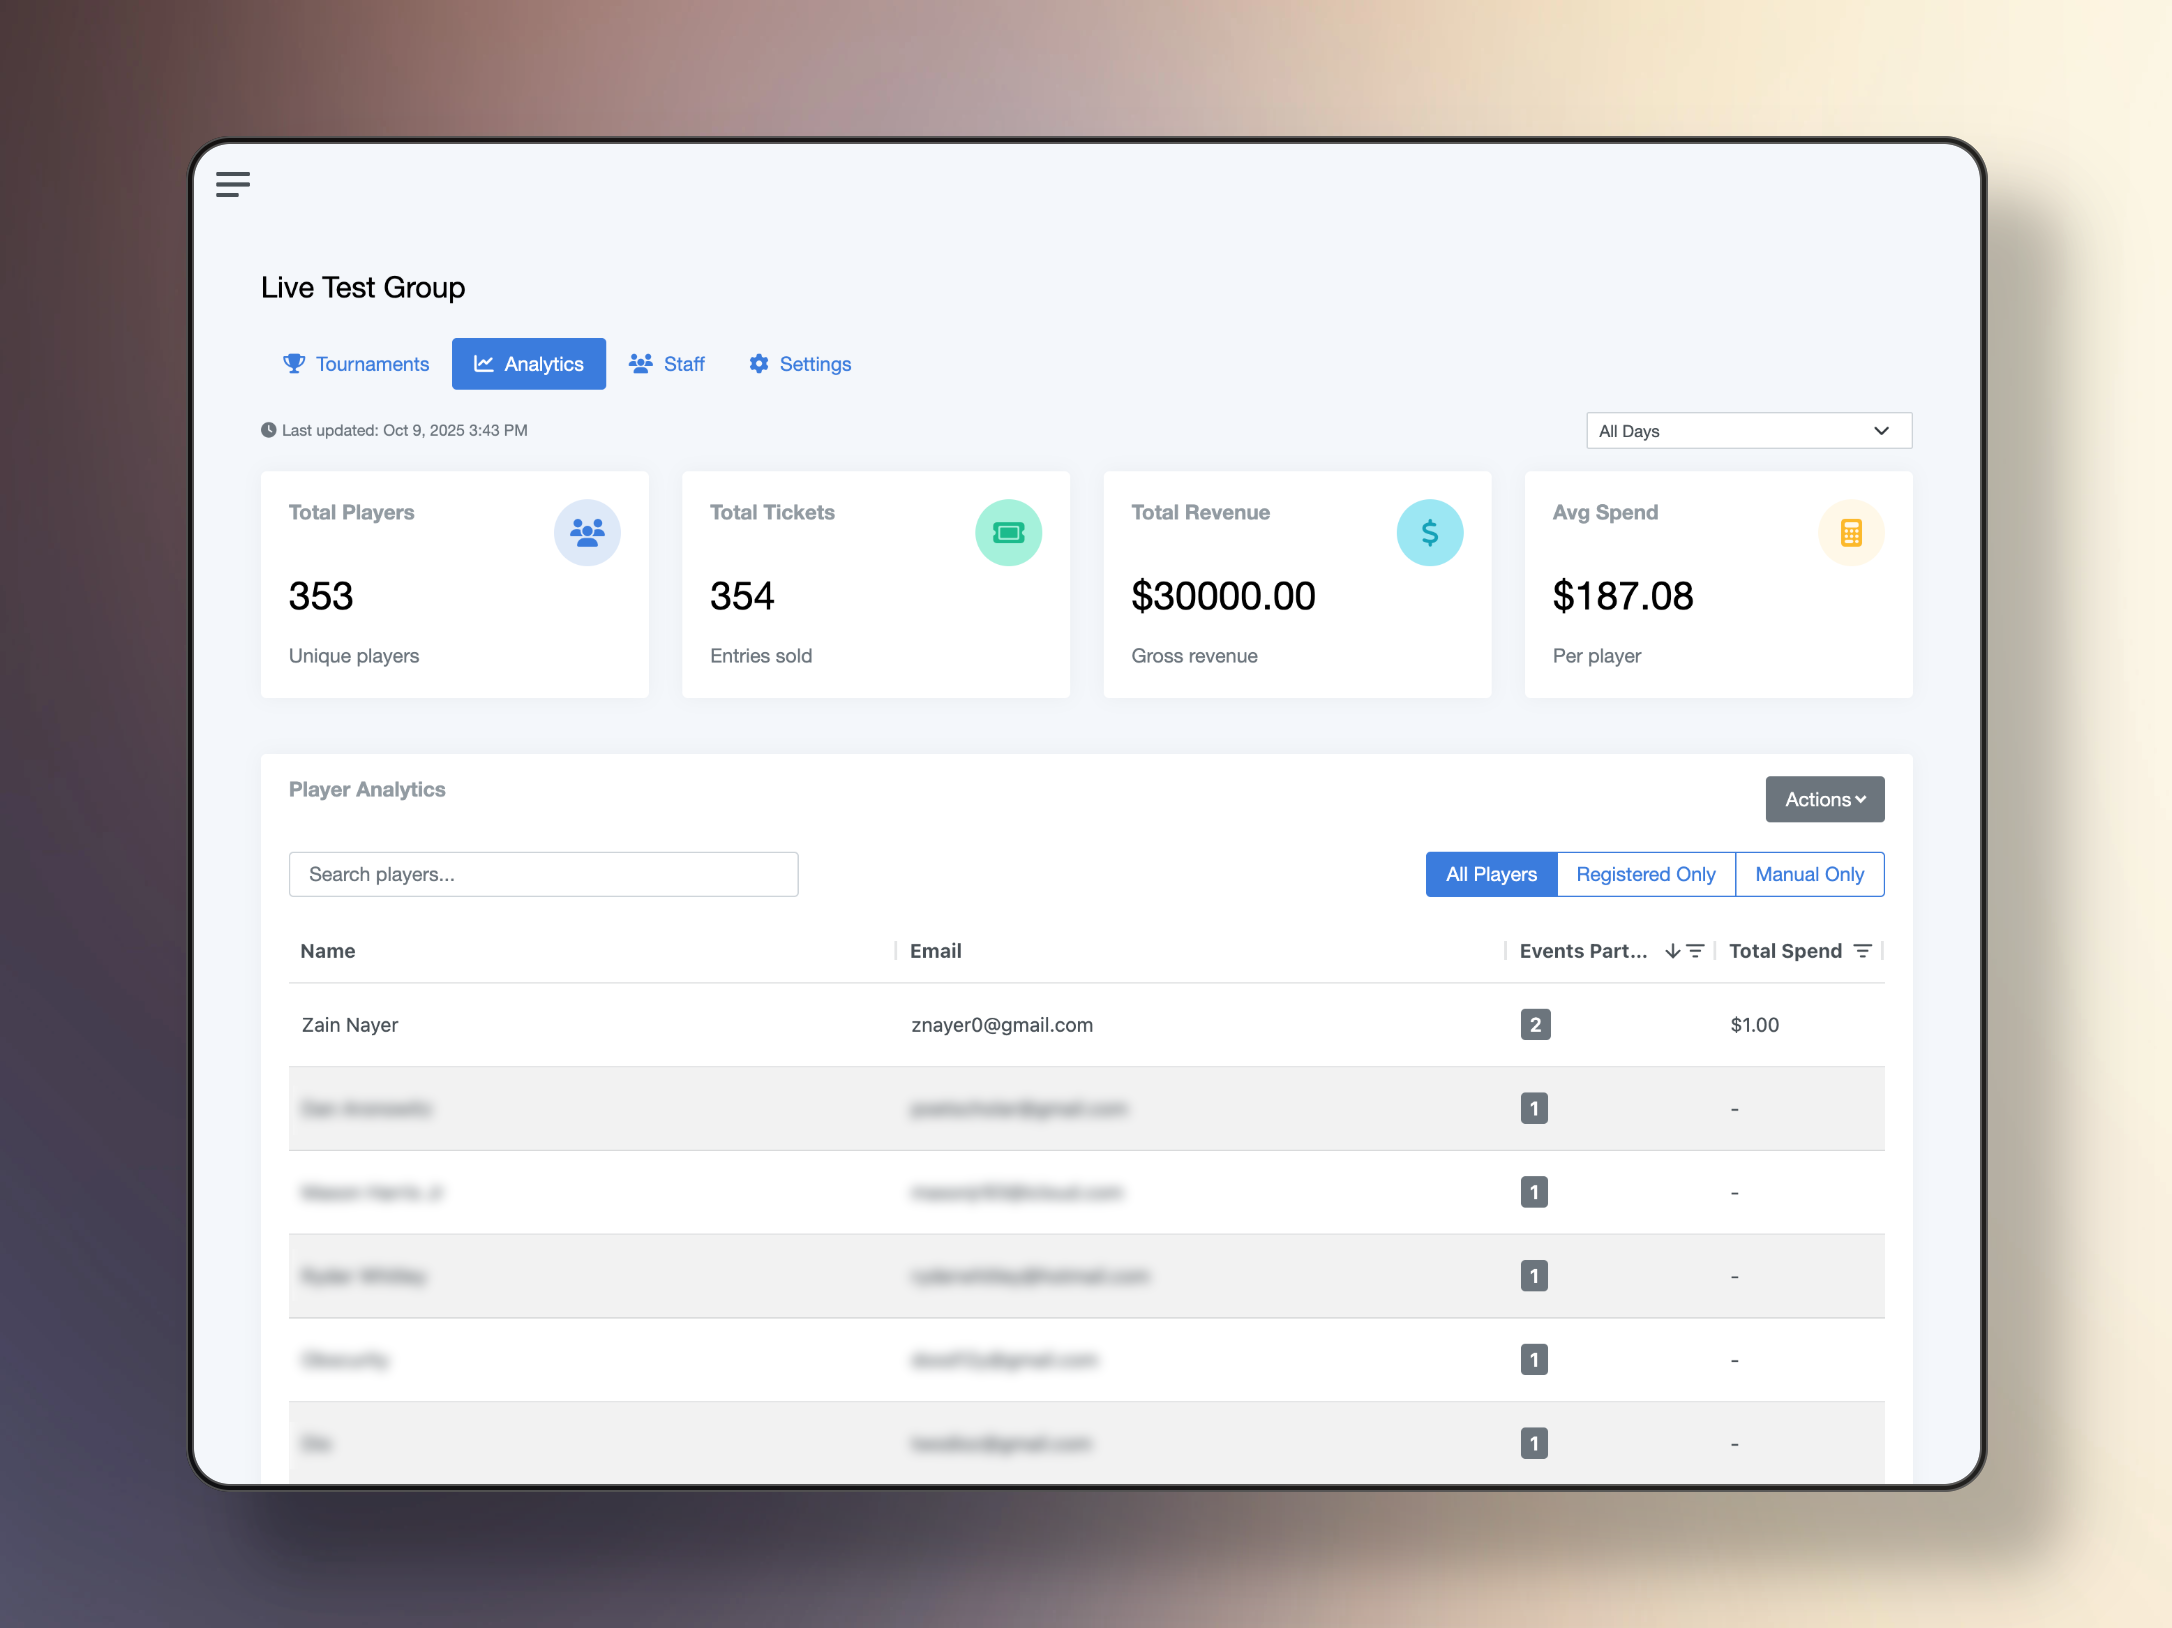
What You'll See
The Analytics Dashboard gives you instant access to key metrics:
- Total Unique Players: See how many different people attended your convention
- Total Tickets Sold: Track every entry across all events (players entering multiple events count multiple times)
- Total Revenue: Real-time revenue tracking across all your events
- Average Spend Per Player: Understand your per-attendee value
Drill Down by Day
Multi-day conventions have different attendance patterns throughout the weekend. Our date filter lets you view metrics for specific days, instantly updating your stats and player list to show only that day's activity.
Perfect for understanding which days drive the most traffic and revenue.
Player-Level Insights
The player table shows everyone who attended with sortable columns:
- Name and Email: Contact information for your attendees
- Events Participated: How many events each player entered
- Total Spend: Revenue per player across all their entries
Filter by registered users (with email addresses) or manually-added players to understand your audience mix. The system automatically deduplicates manual players with the same name - so if "John Smith" played in three events, he appears once with a count of three events.
Export for Further Analysis
One-click CSV export gives you all your analytics data for importing into your accounting software, sharing with stakeholders, or deeper analysis in Excel.
Built for Convention Organizers
Whether you're running a local game store weekend event or a major regional convention, the Analytics Dashboard gives you the insights you need to:
- Report accurate revenue numbers
- Understand player retention across days
- Identify your most engaged attendees
- Plan future events based on real data
The dashboard refreshes automatically and caches for 24 hours to keep things fast, with manual refresh available when you need the latest numbers.
Get Started
The Analytics Dashboard is available now in the Group Manager for all TopDeck.gg convention organizers. Create or access your convention to see your analytics.
Questions about using the Analytics Dashboard? Reach out anytime:
Zain
The TopDeck.gg Team